Spydify
A web-app which connects to Spotify and shows users visualisations and metrics to help them explore their music tastes and find new artists and songs.
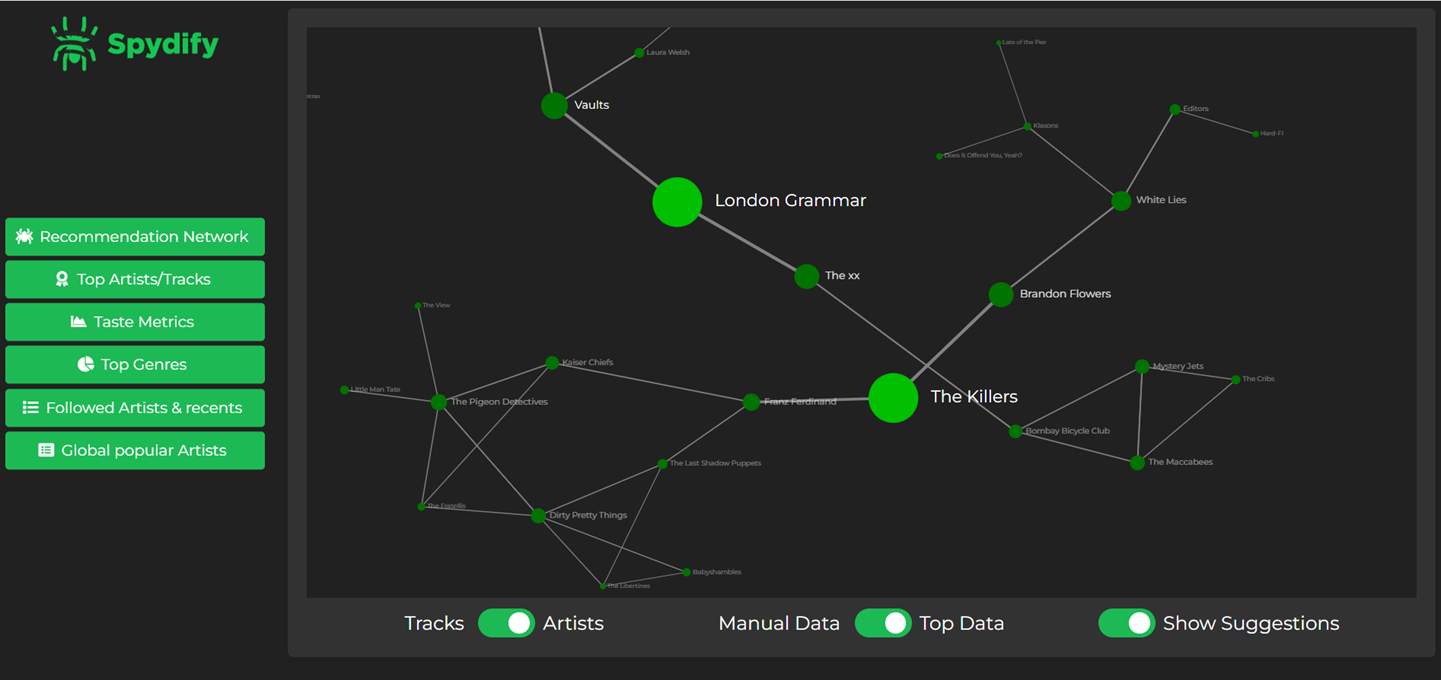
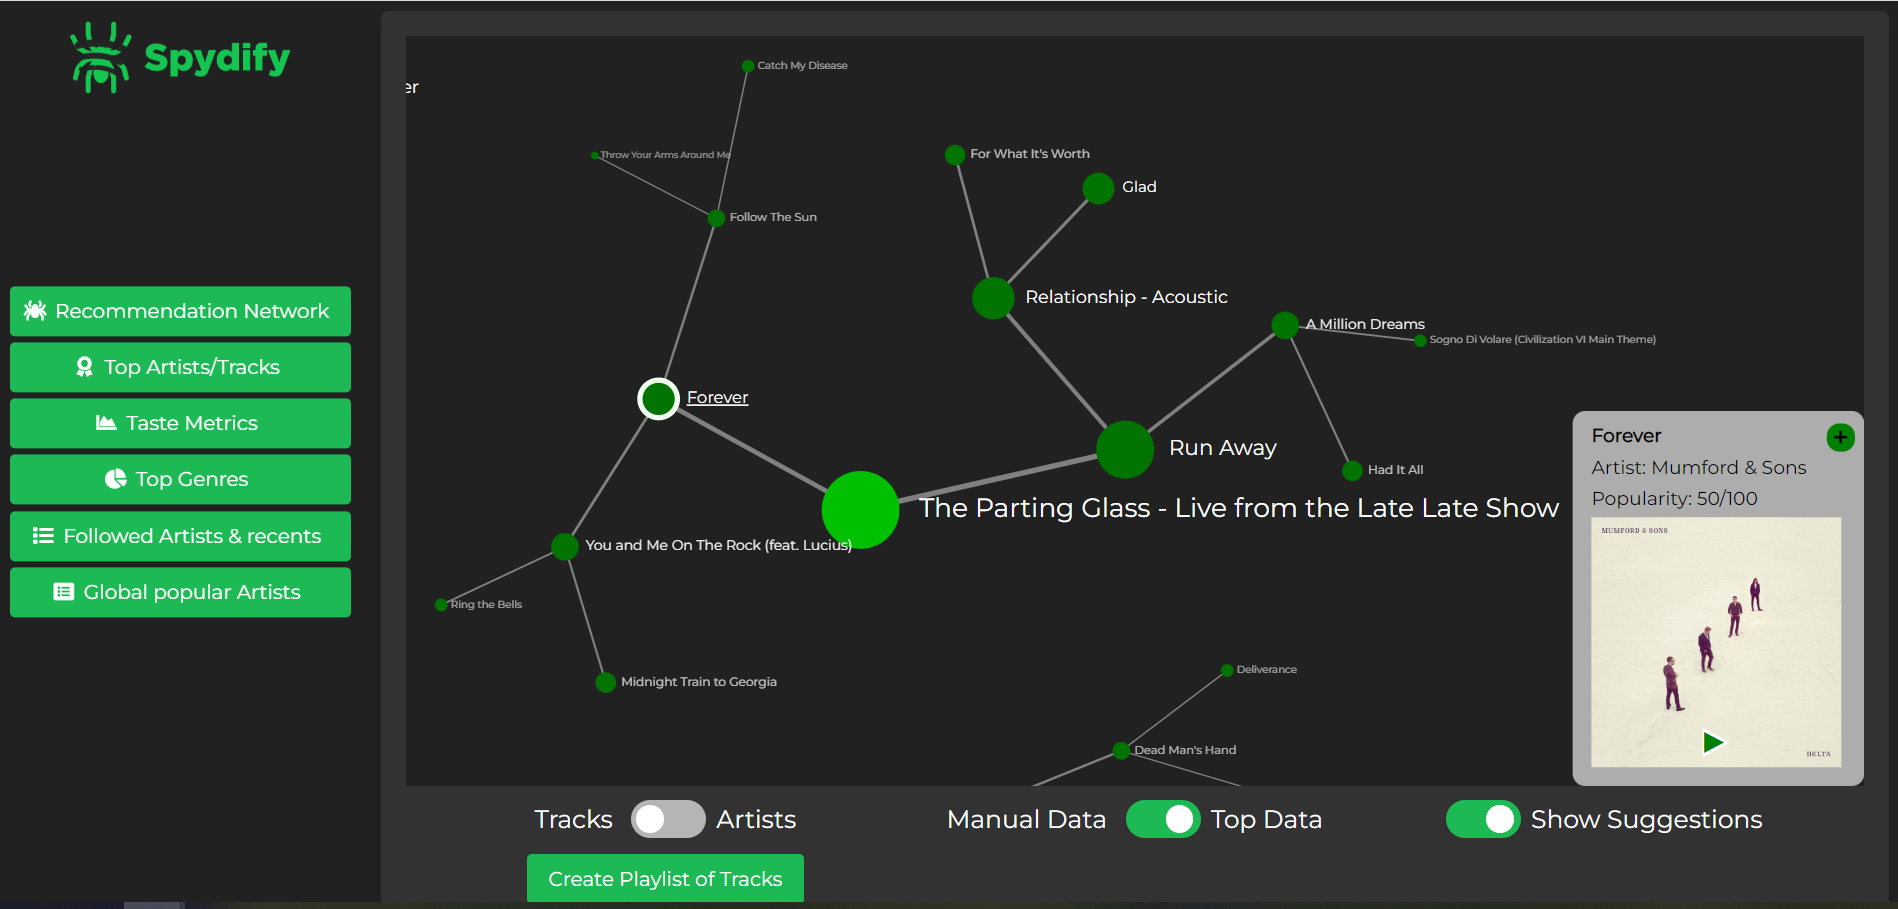
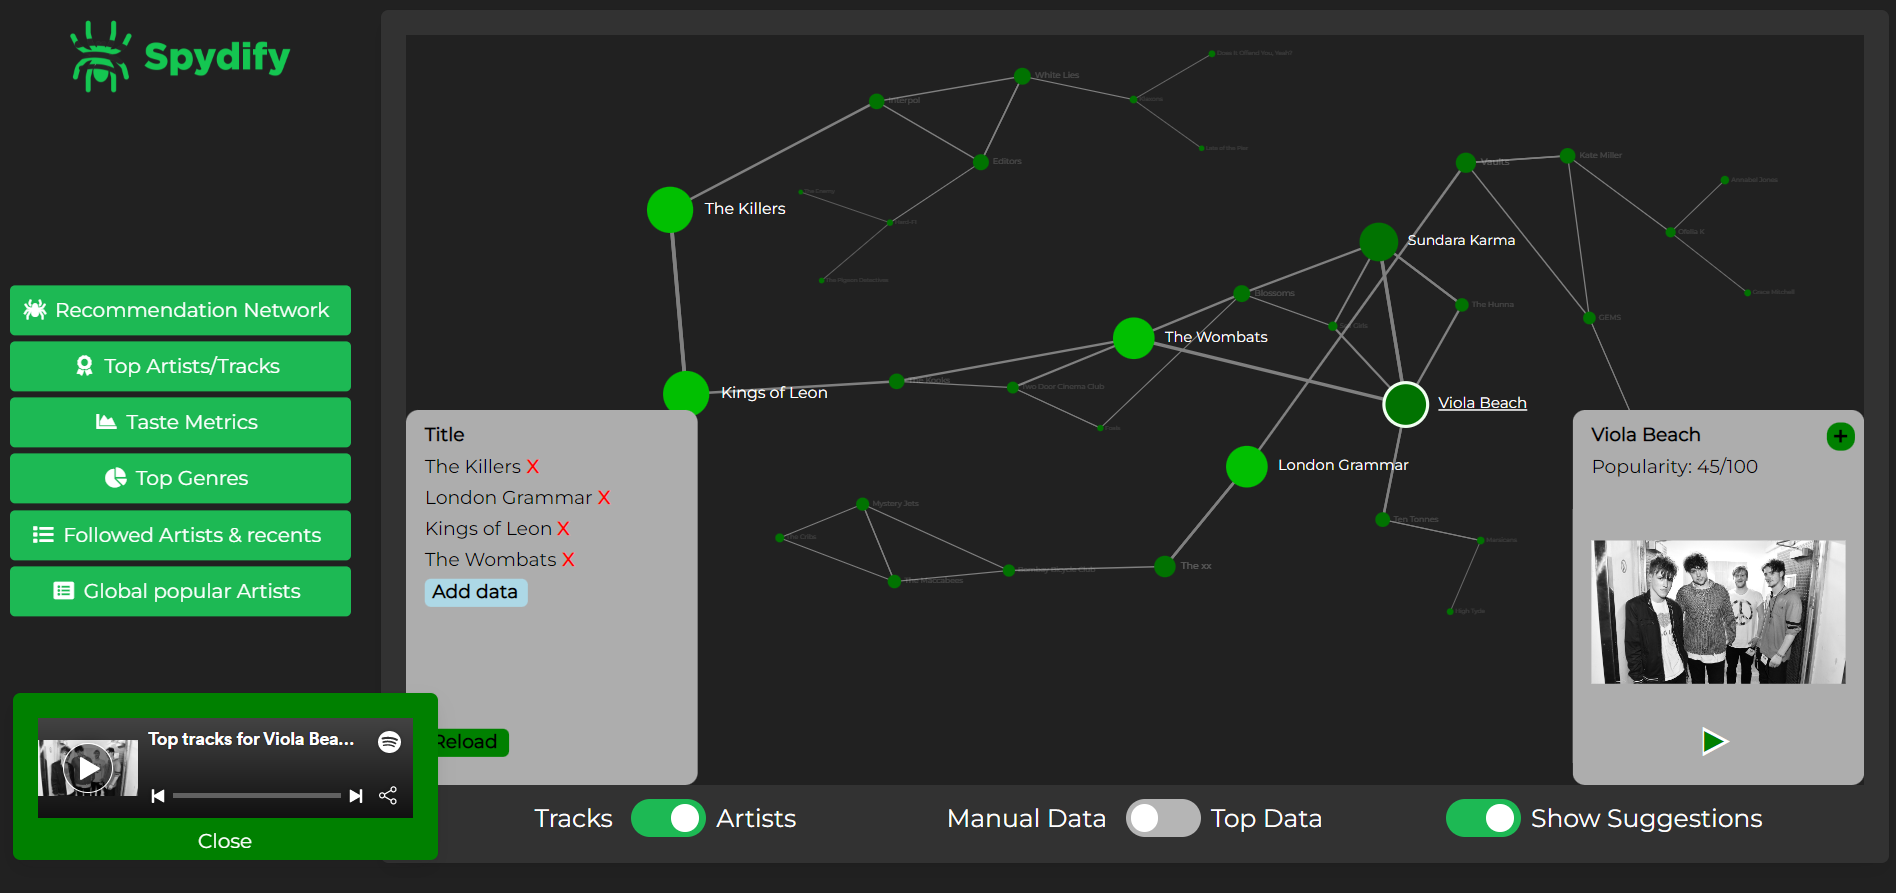
The primary focus of the application is an interactive network-graph (web) of connected tracks or artists based off a user's top 3 artists to allow them to explore how their music tastes are connected and suggest similar artists or tracks they may want to listen to. As well as this, the application also includes:
- The ability to create a playlist of the suggested tracks in the graph
- The ability to play snippets of suggested tracks or artists directly in the application
- The ability to input custom tracks or artists to see how they are related or receive suggested similar music
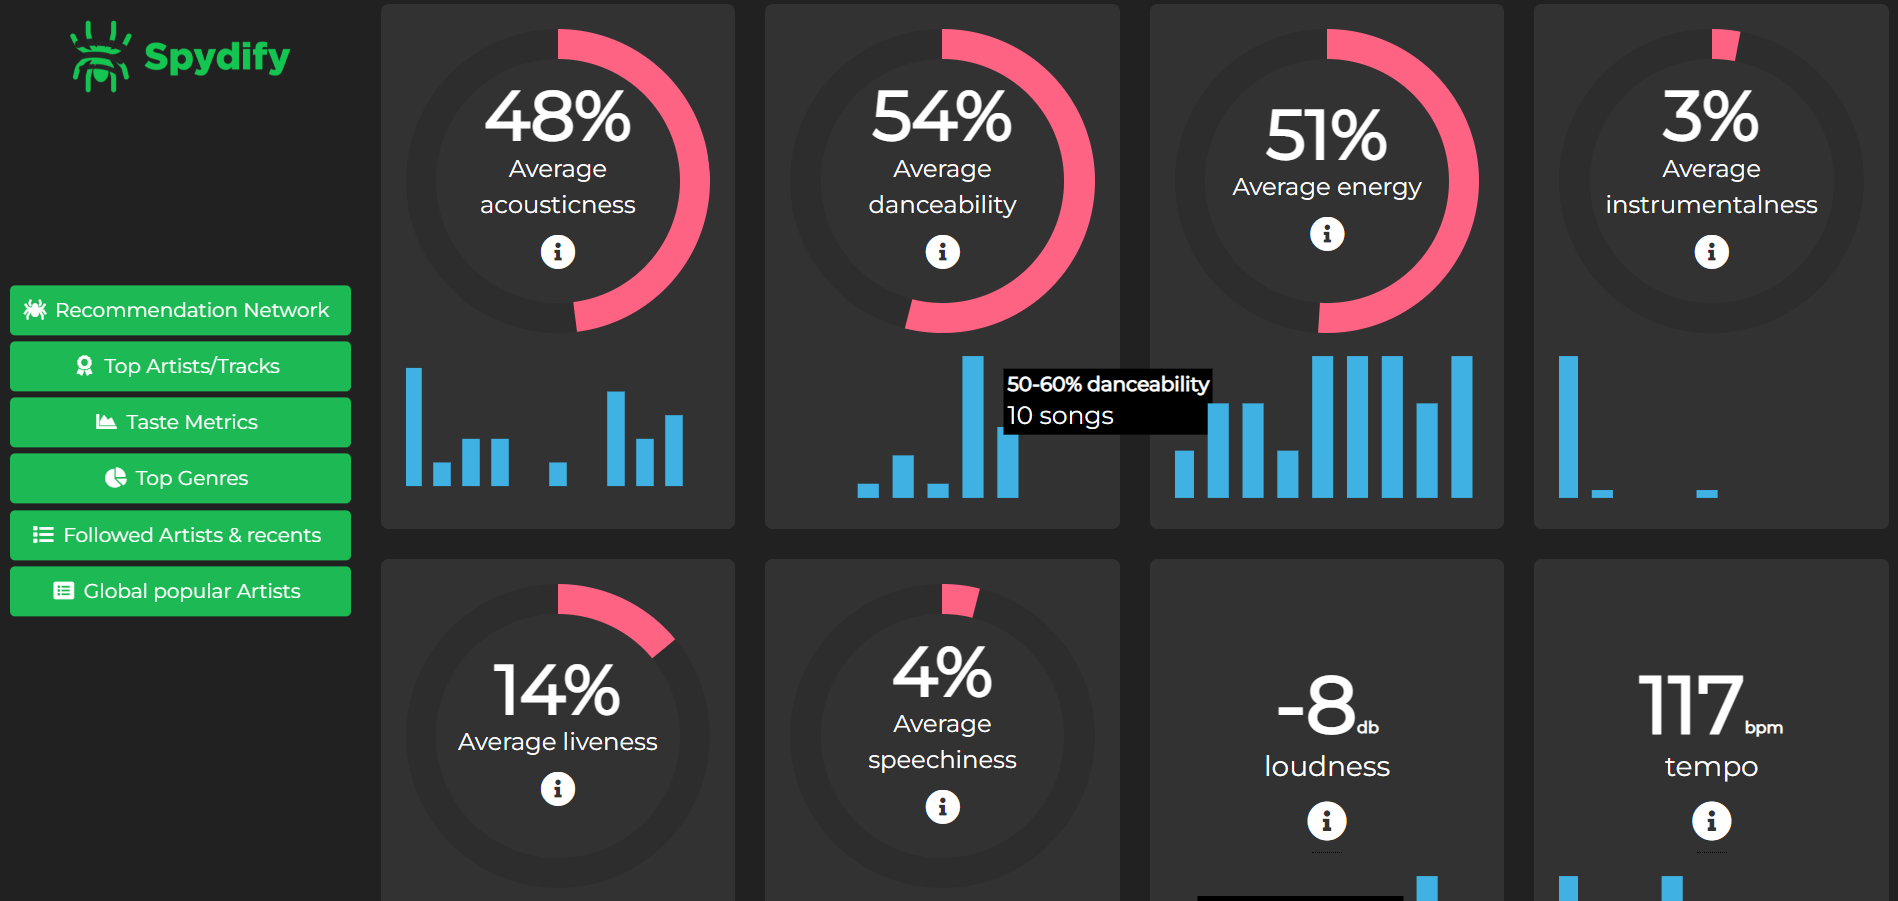
- Visualisations of Spotify's hidden user metrics (such as the average danceability or tempo of your top tracks)
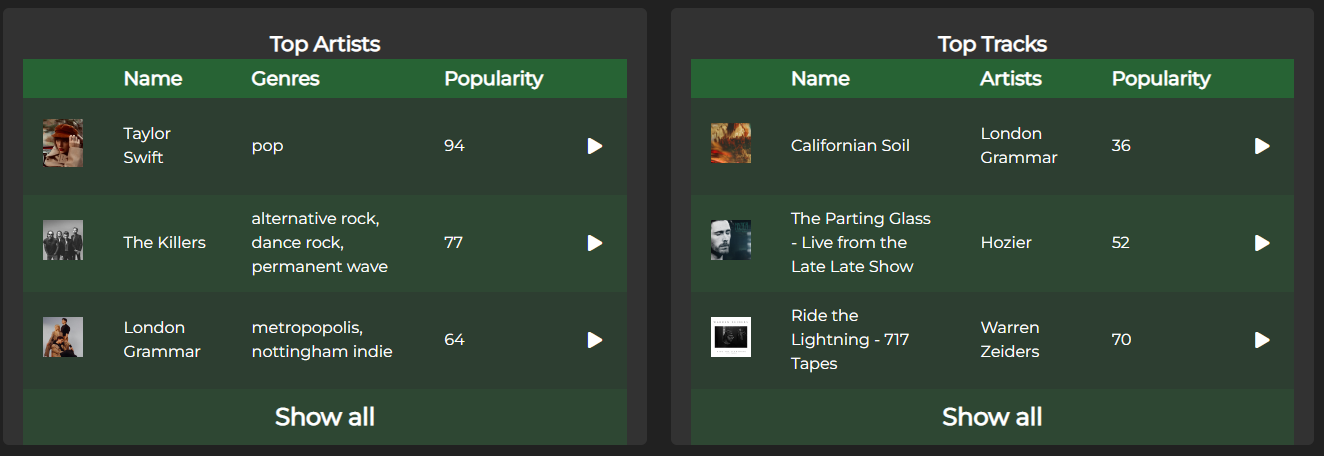
- Lists of your recent top tracks and artists
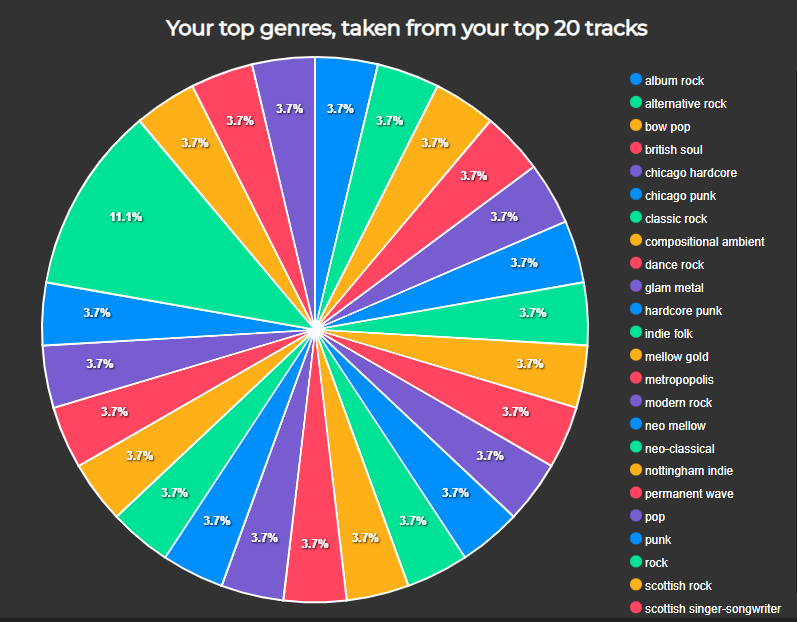
- A visualisation of the genres your top tracks fit into
The application was developed in a group as part of my university degree and achieved a mark of 82% as well as a specific commendation from the University's start-up incubation team. My specific role within the team was as a frontend developer -- in particular, I developed the graph visualisation component. For displaying the graph, we initially looked at 3rd-party libraries, but found that none had the flexibility and features that we wanted. So instead, I developed a custom system for generating graphs, using the D3 data visualisation library. This approach allowed for full control over the layout and functionality of the graph, and meant that we could implement zooming and dynamic fading of graph labels as the zoom level changes.